

report
Environmental report
Introduction
A carbon footprint is the total set of greenhouse gas ('GHG') emissions caused by an organisation, event, product or person. GHGs are emitted through transport, land use change, the production and consumption of food, fuel combustion, manufactured goods, material consumption, waste disposal and use of services. A carbon footprint is usually reported in CO2e (carbon dioxide equivalent) which is the internationally recognised measure of GHGs.
Methodology
The carbon footprinting methodology was undertaken according to the international methodology Greenhouse Gas Protocol Initiative ('GHG Protocol').
The GHG Protocol is the most widely used standard for mandatory and voluntary GHG reports and is compatible with other international GHG standards such as ISO 14064. It is derived from a multiple-stakeholder partnership of businesses, NGOs and governments led by the World Resources Institute and the World Business Council for Sustainable Development.
CO2e is the standard unit of measurement for GHGs emissions. Each of the gases has a global warming potential measured against carbon dioxide ('CO2') that allows for conversion to CO2 equivalent. Activity data is converted to CO2e using emission factors.
The emission factors used in the calculations are from the Department of Environment, Food and Rural Affairs ('DEFRA') database from the United Kingdom.
The GHGs covered by this calculation are CO2 methane ('CH4'), nitrous oxide ('N2O'), hydrofluorocarbons ('HFCs'), perfluorocarbons ('PFCs'), sulphur hexafluoride ('SF6') and nitrogen trifluoride ('NF3').
EOH carbon footprint
Table 1 indicates the carbon footprint for EOH.
Table 1: GHG emissions: EOH
| Scope | Emission source | 2021 emission (tonnes CO2e) |
| Scope 1 | Mobile consumption (Company-owned vehicles) – diesel | 256 |
|---|---|---|
| Scope 1 | Mobile consumption (Company-owned vehicles) – petrol | 225 |
| Scope 1 | Stationary consumption – backup generators | 56 |
| Scope 1 | Refrigerants and air-conditioning | 582 |
| Total scope 1 | 1 119 | |
| Scope 2 | Purchased electricity | 5 778 |
| Total scope 2 | 5 778 | |
| Scope 3 | Water consumption kilolitres – municipal | 7 |
| Scope 3 | Estimated business air travel (passenger kilometres) | 666 |
| Scope 3 | Rental car travel distance (kilometres) | 225 |
| Scope 3 | Business travel in employee-owned vehicles (kilometres) | 2 046 |
| Scope 3 | Paper consumption – A4 (number of reams) | 10 |
| Scope 3 | Waste disposal | 4 |
| Total scope 3 | 2 958 | |
| Total | 9 855 |
The following graph shows a comparison of emissions (tCO2e) measured since 2012. It should be noted that due to the receipt of updated electricity consumption data and diesel consumption for backup generators for 2018 and 2019, the historical data was adjusted accordingly.
Emissions measured since 2012 (tCO2e)
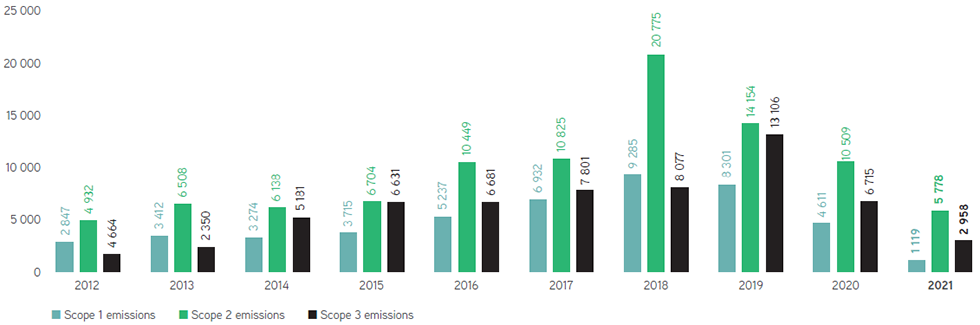
Figure 1: Emissions measured since 2012
Refer to table 2 for the main indicators.
Breakdown of emissions (%)
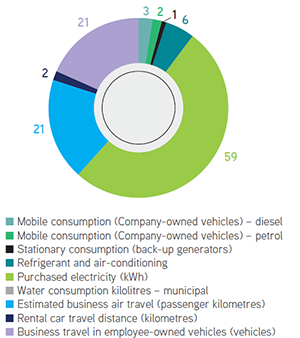
Figure 2: Scope 1, scope 2 and scope 3 emissions for 2021 (tCO2e)
Comparison of emissions (2020 – 2021)
During the financial year, a number of factors contributed to the reduction of scope 1, scope 2 and scope 3 emissions.
Table 2: Carbon emissions main indicators since the previous financial year
Main indicators
| 2021 | 2020 | % change | |
| Scope 1 emissions (tonnes CO2e) | 1 119 | 4 611 | (76) |
|---|---|---|---|
| Scope 1 emissions per employee | 0.18 | 0.55 | (66.86) |
| Scope 2 emissions (tonnes CO2e) | 5 778 | 10 509 | (45) |
| Scope 2 emissions per employee | 0.94 | 1.25 | (24.92) |
| Scope 3 emissions (tonnes CO2e) | 2 958 | 6 715 | (56) |
| Scope 3 emissions per employee | 0.48 | 0.80 | (39.85) |
| 1 | Scope 1 emissions are direct emissions from sources that a company directly owns or has control over |
| 2 | Scope 2 emissions are from purchased electricity, heat or steam |
| 3 | Scope 3 emissions are a consequence of a company’s activities but occur at sources owned or controlled by another company. |
Scope 1 emissions
A number of business units owning company cars are no longer with EOH; therefore, the number of pool cars drastically reduced during the
financial year. In addition, approximately 37 leased buildings were exited, one building was sold and 13 buildings were mothballed. Therefore,
due to the reduced number of pool cars, vehicle emissions have reduced, and due to the reduced number of buildings occupied, fugitive
emissions from refrigerants and air-conditioning units have reduced. In addition, it is expected that the lockdown period due to the COVID-19
pandemic played a role in the reduction of scope 1 emissions due to the reduced use of company-owned vehicles and reduced use of
air‑conditioning in buildings.
Figure 1 indicates that overall scope 1 emissions have reduced since 2018. Refer to figure 3 indicating scope 1 emissions per employee. This figure shows a drastic reduction in scope 1 emissions.
Scope 1 emissions per employee (tCO2e)
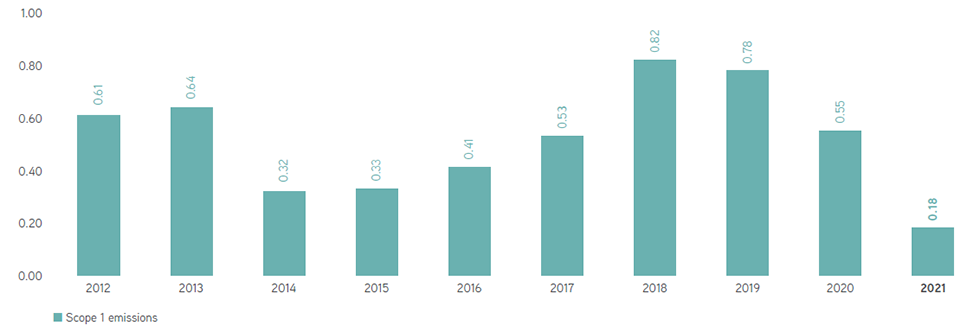
Figure 3: Scope 1 emissions per employee
Figure 4 indicates the fuel consumption from company-owned vehicles (pool cars), indicated per employee.
Fuel consumption per employee (litres, diesel and petrol)
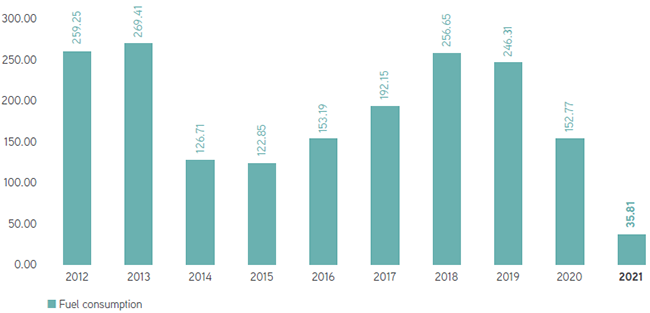
Figure 4: Fuel consumption per employee
Scope 2 emissions
Figure 1 indicates that overall scope 2 emissions have reduced since 2018. Due to the reasons
given above (exiting of leases of buildings) as well as lockdown, it would be expected that electricity
consumption (scope 2 emissions) was reduced.
Refer to figure 5 indicating scope 2 emissions per employee. This figure shows a reduction in scope 2 emissions.
Scope 2 emissions per employee (tCO2e)
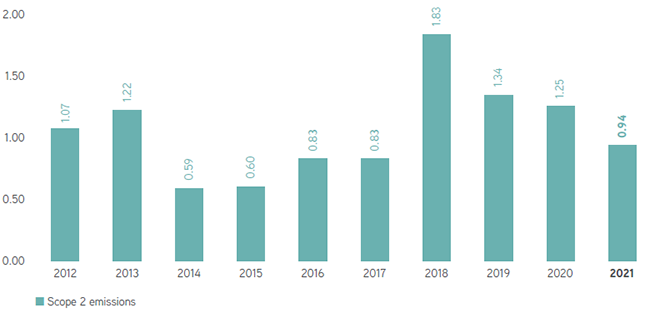
Figure 5: Scope 2 emissions per employee
Scope 3 emissions
Due to the reduction of occupied buildings as well as the lockdown period, water consumption was
reduced (refer to figure 6 indicating the water consumption per employee). Air travel, use of hired cars,
use of personal vehicles for business purposes and paper consumption has also reduced. Refer to
figure 7, figure 8, figure 9 and figure 10.
Water consumption per employee (kilolitre)
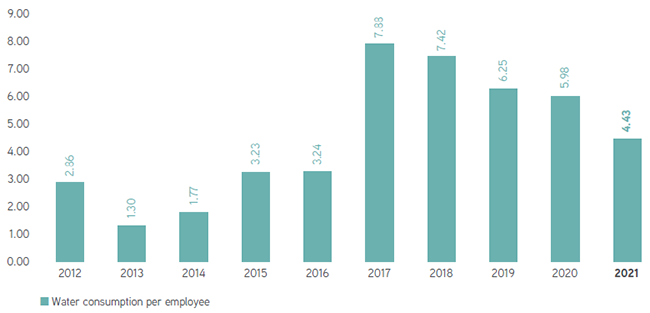
Figure 6: Water consumption per employee
Other scope 3 emissions are indicated below.
Estimated business air travel per employee (passenger kilometres)
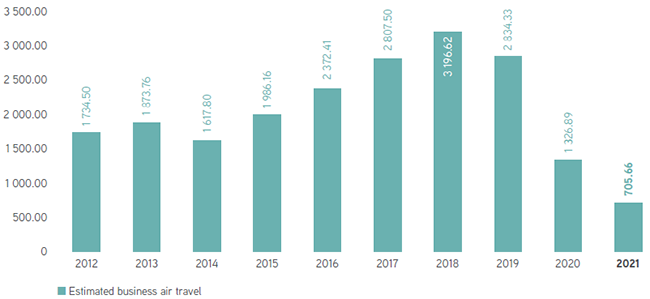
Figure 7: Business air travel (passenger km) per employee
Business travel in rental cars per employee (kilometres)
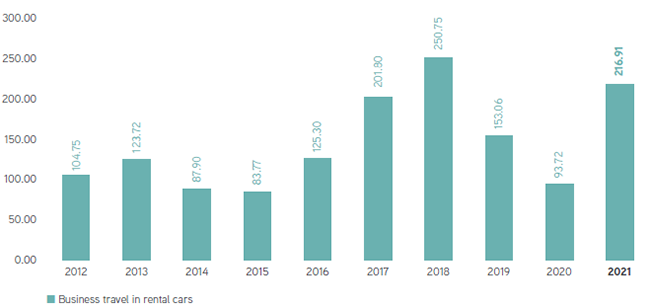
Figure 8: Business travel in rental cars, per employee
Employee travel in personal cars for business purpose per employee (kilometres)
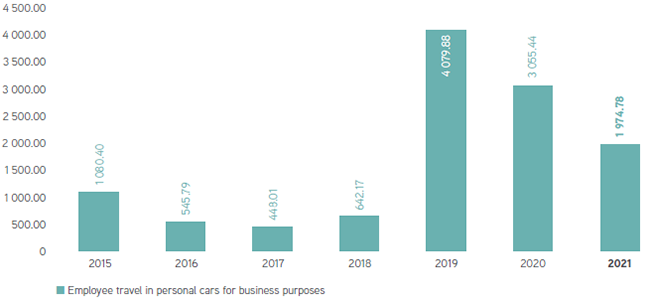
Figure 9: Employee travel in personal cars for business purposes (km)
Paper consumption tonnes per employee (estimated)
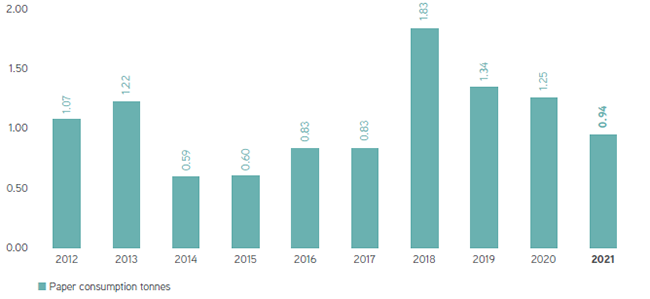
Figure 10: Paper consumption per employee